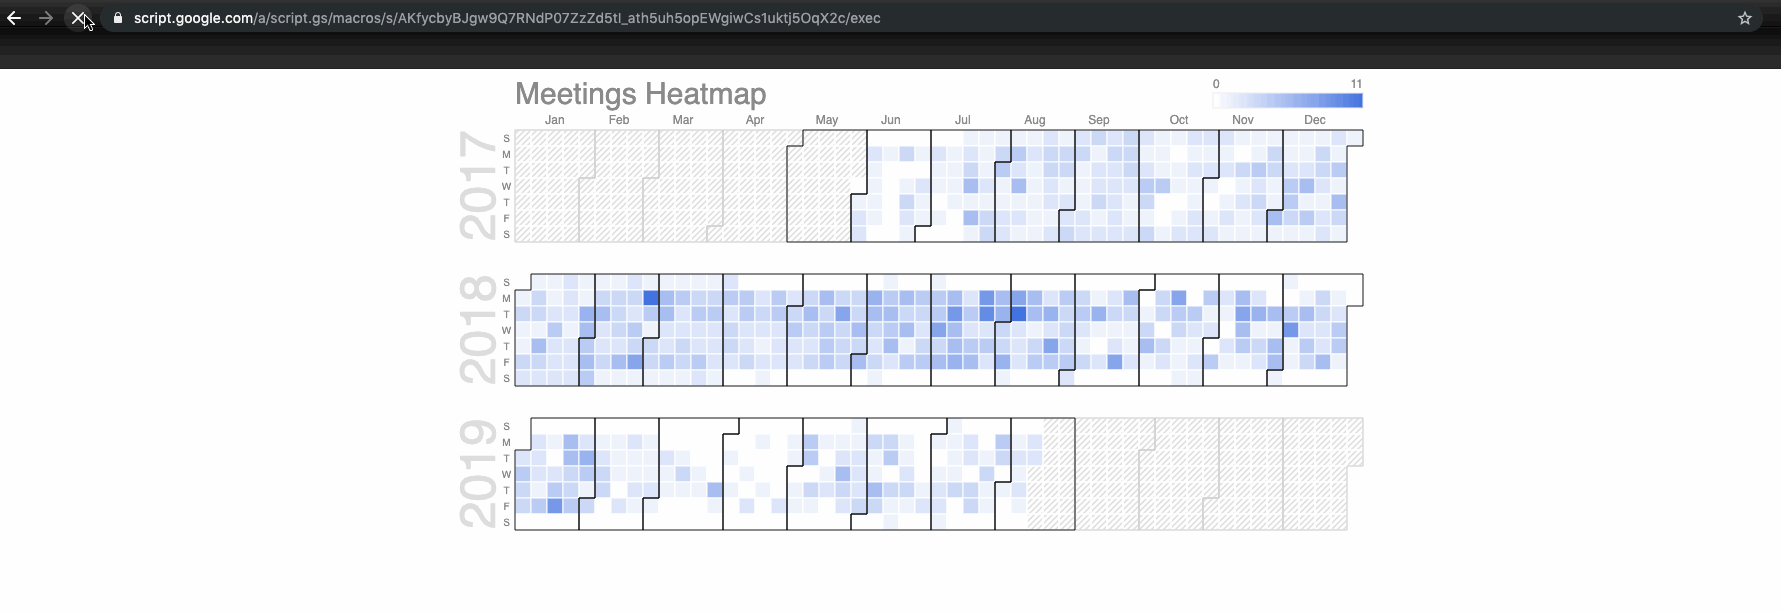
Github-like contributions heat map, but for meetings
Create a meetings heat map dashboard view using Google's Calendar Chart and Apps Script.

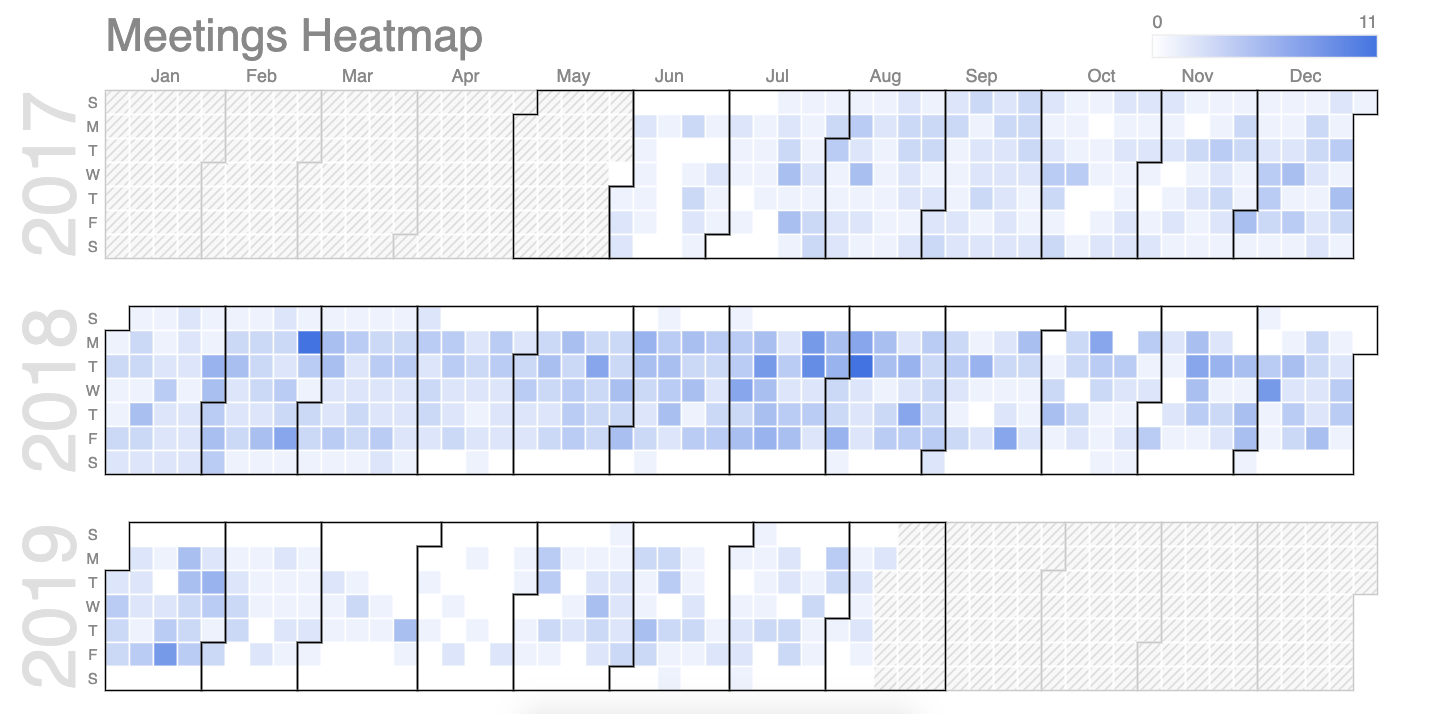
in case you're wondering what that thing about github is - its their heat map view of all the contributions one makes, thats made available for public viewing. here are some examples -
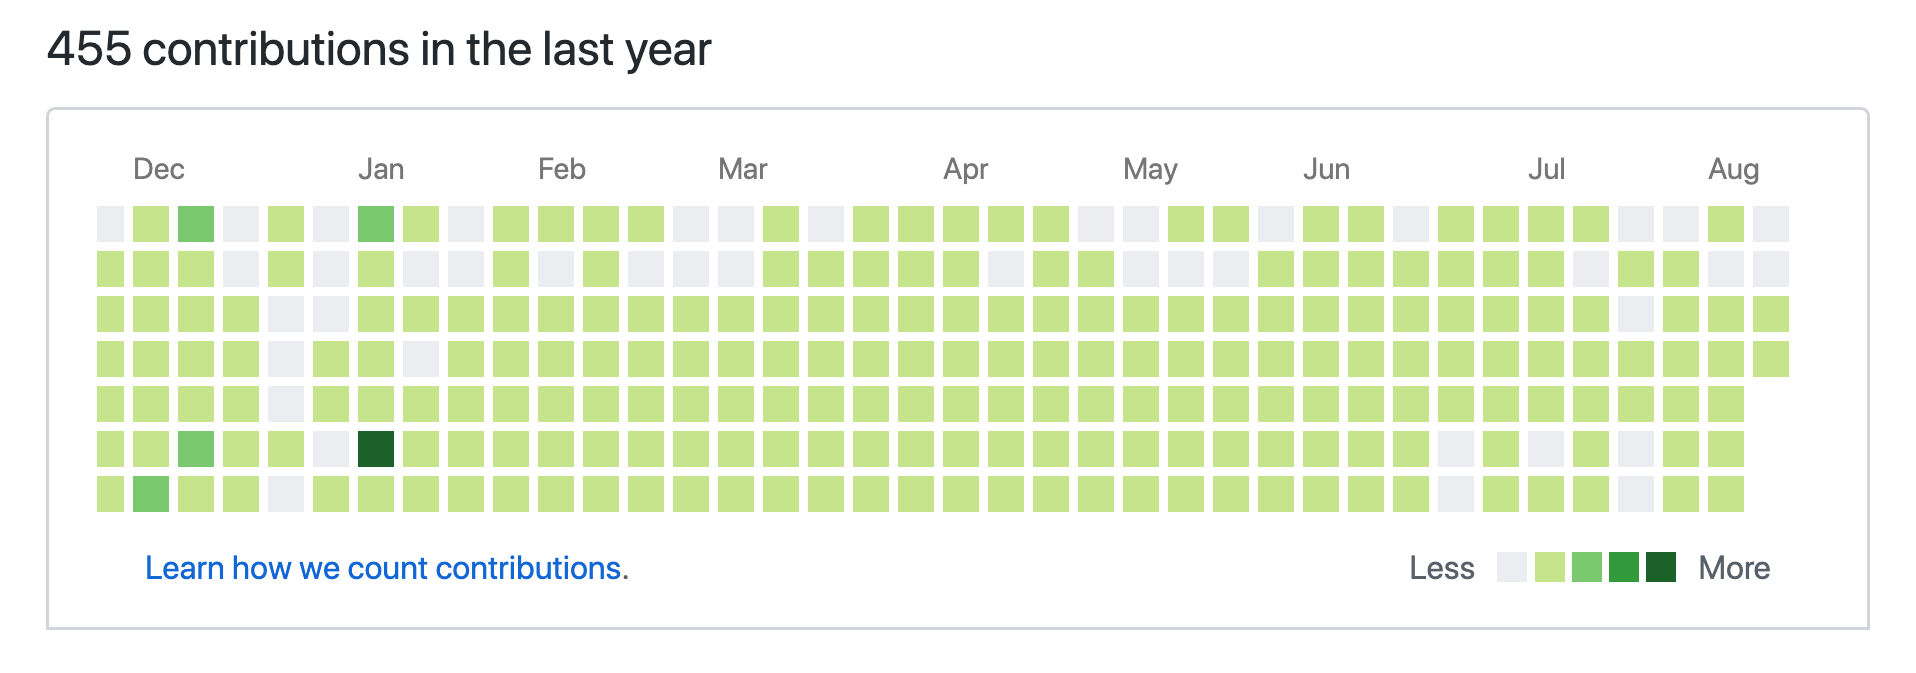
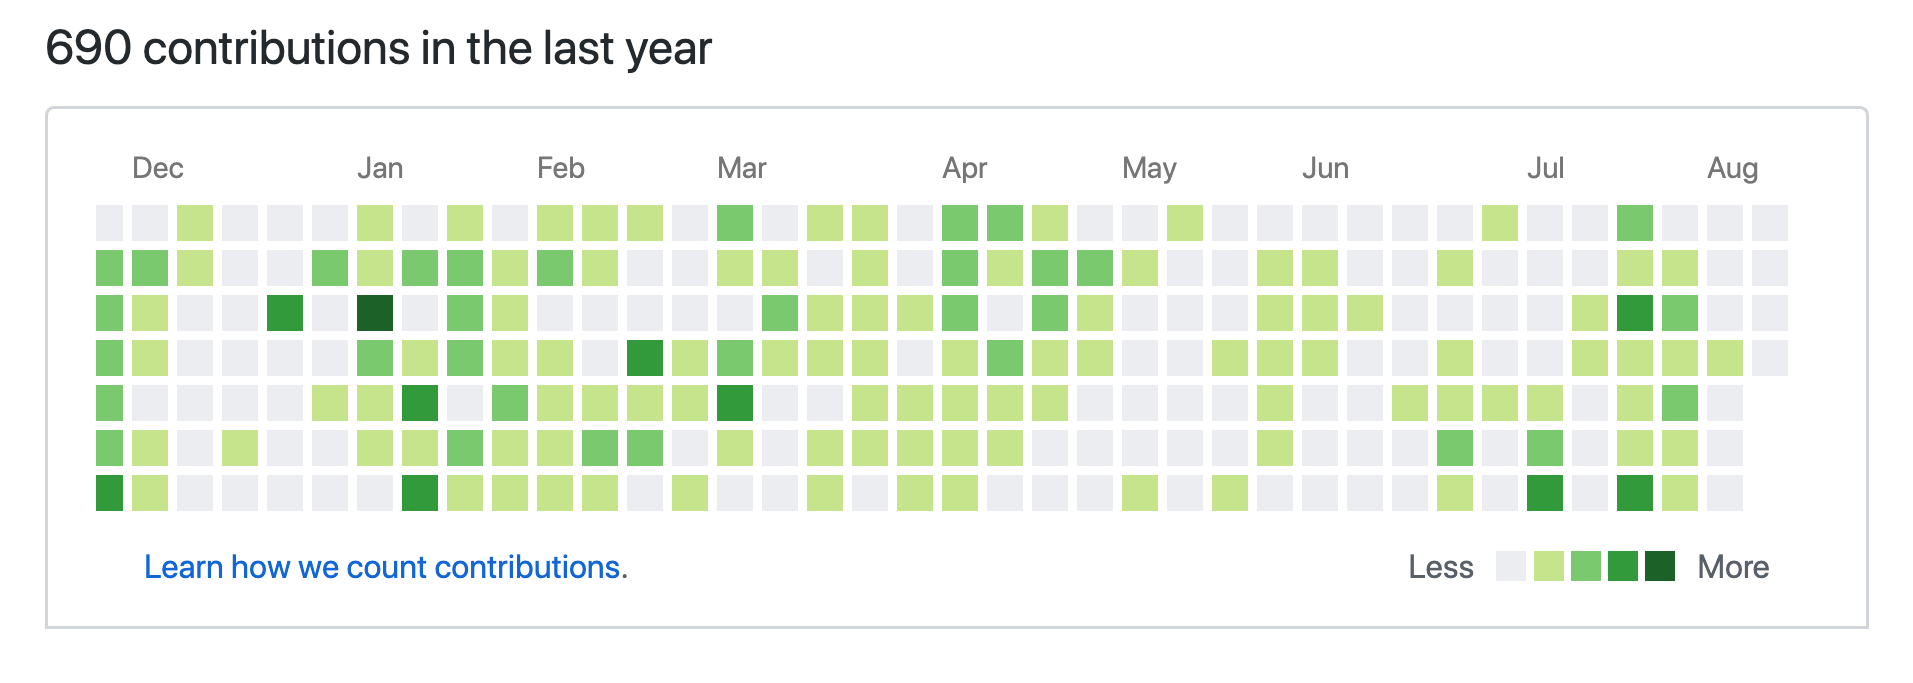
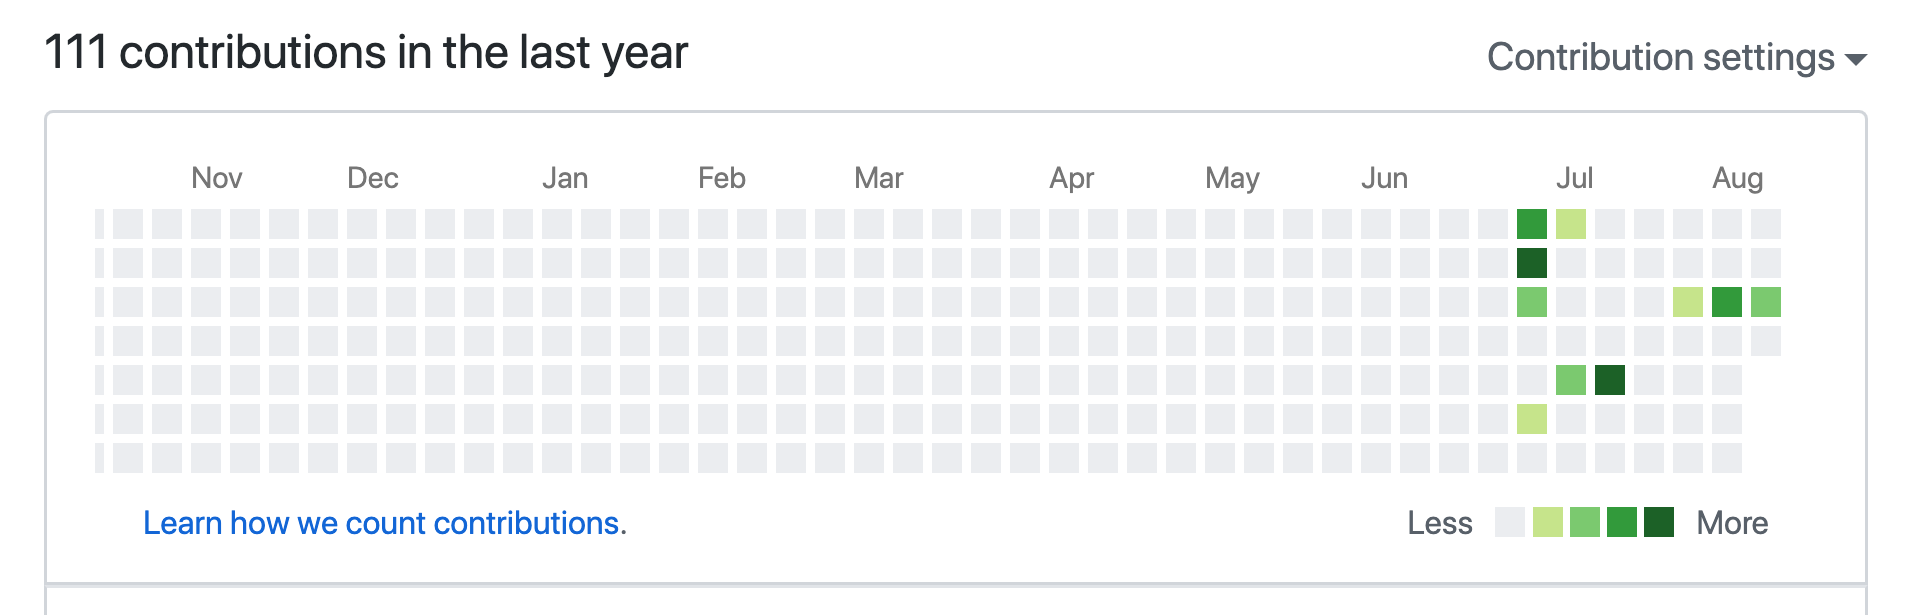
i know, mine's pretty pathetic at this point in time 😅
context
this was an accidental idea that i'd stumbled upon while trying to figure out what would be the best d3.js chart* i could use on one of my other projects that required for the ability to create relations across a multi-dimensional data set, all of which structured within a time series. for some reason, d3 turned out to be more complex that i had originally imagined and so i turned to the good ol' reliable google charts for visualisation.
*collapsible tree chart was the answer
in the interest of brevity, you may refer to the calendar chart - which is where the 'chart' part of the code has been adopted from.
problem statement
well, this ones not really the kind of solution that actually solves any real problem - but so far as for inferring how many meetings you've been a part of over time, it could prove to be a good tool. mid-way through this undertaking, i realised that given the kind of data structure that this visualisation consumes, it makes it possible to virtually use it for anything where you may have dates in one column and the count of values on the next.
architecture
the script has been structured to -
- ask for a start date (i.e. the data from when you'd want to see the heatmap from).
- couldn't figure out a way to determine when a particular account was created; would be happy to adapt should someone know the answer 😊
- create a new spreadsheet in your google drive, automatically.
- start iterating through your calendar for the count of events from the specified start date and log them one after the other in the newly created spreadsheet.
- display the progress of the data being logged in real-time by constantly reading through the last updated date from the sheet.
- showcase the meetings heatmap using google's calendar chart.
there's more...
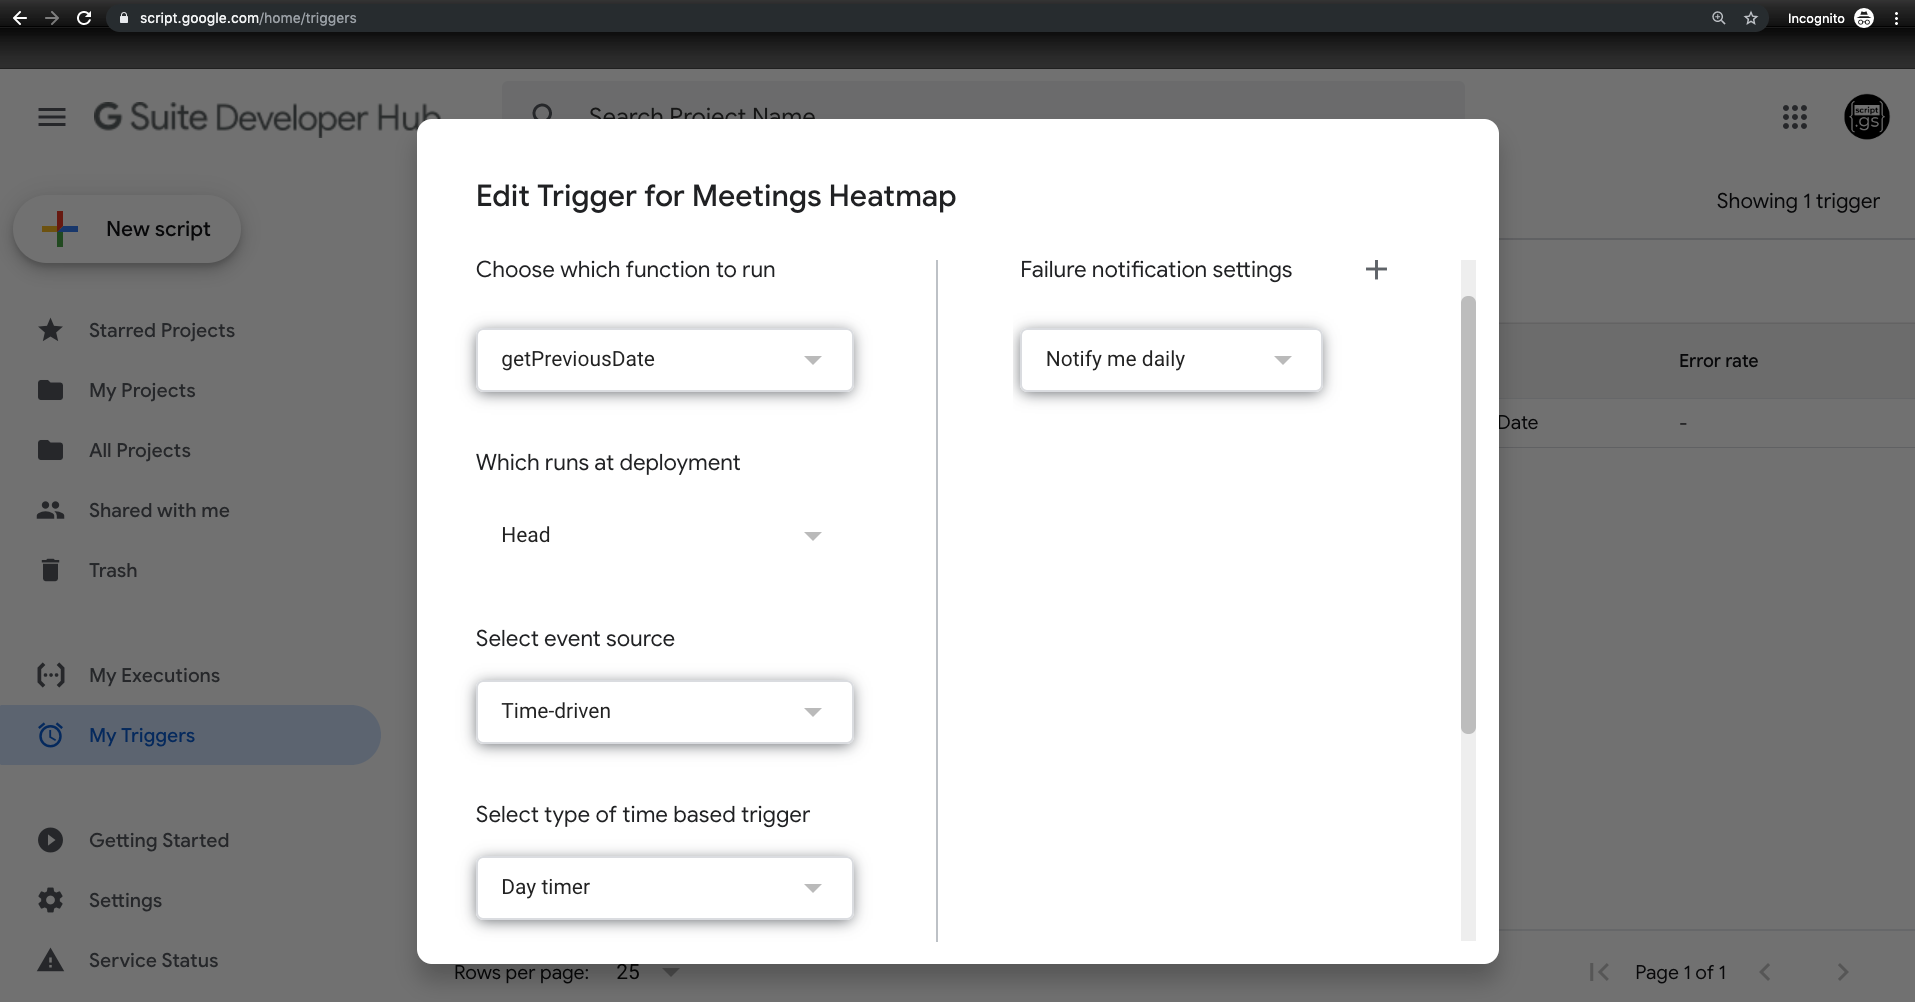
i've also been mindful of the script exceeding its maximum time, which, is what paved the way for another mechanism to bypass script execution timeout, programmatically.
icing on the cake
the script ends with setting up a final time based trigger (scheduled to execute every day) and automatically continue to update the count of events for the day before.
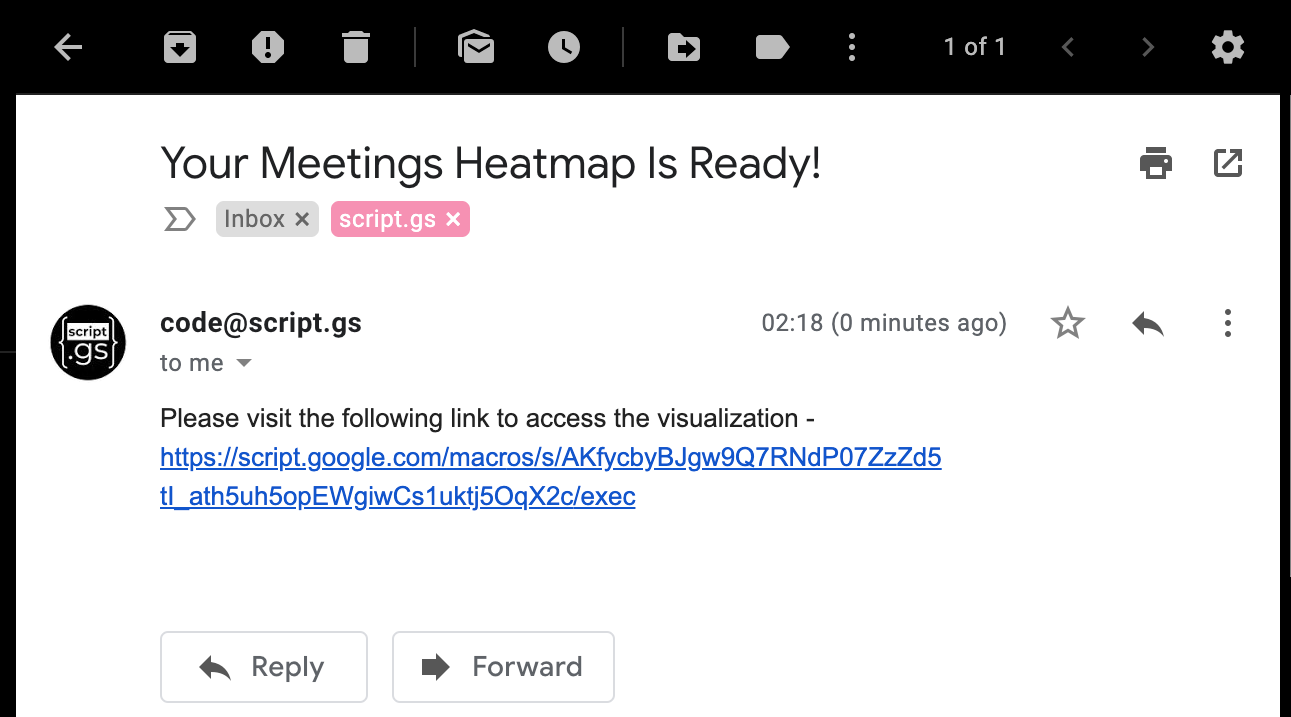
notification
in case you accidentally close the web app window or wish to not be indulged in its real-time updates, you can rest be assured of being notified via an email with the link to view the visualisation, once the script fully executes and successfully terminates.
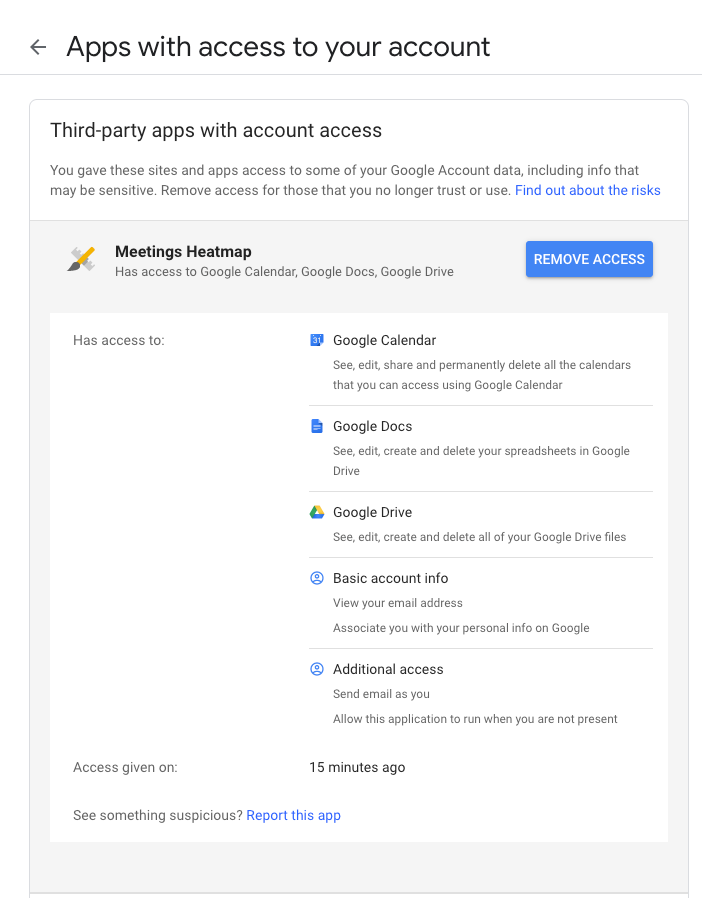
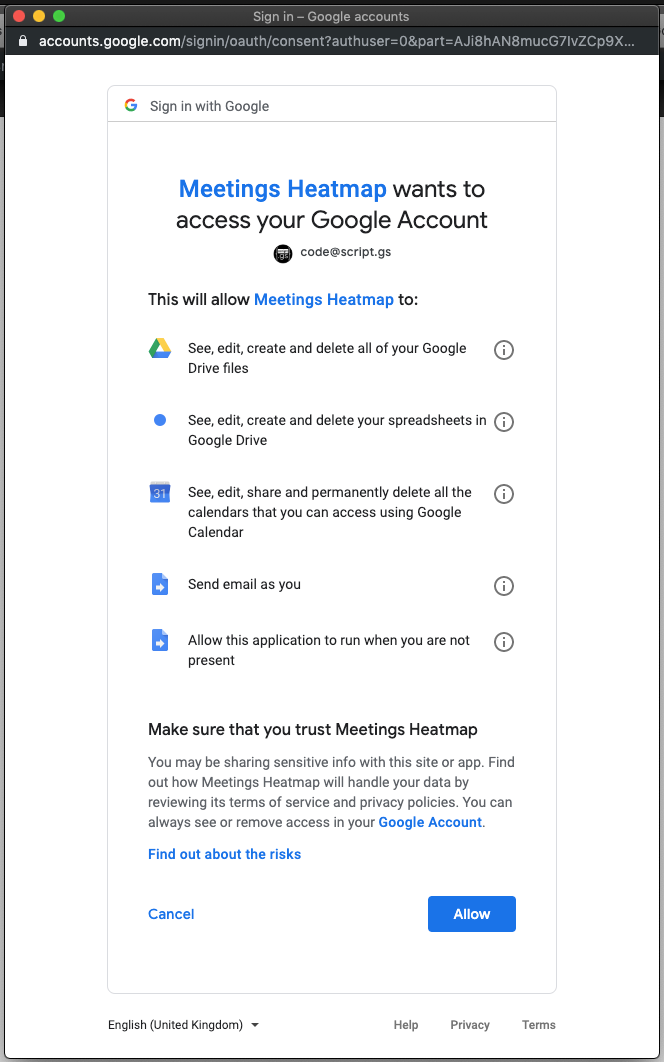
permissions
this is rather a more critical aspect of this setup which can totally be a dealbreaker for most users. simply put, the script asks for a ridiculously alarming kinds and numbers of permission.
here's a summary -
now, a few of these can obviously be taken off. for example, we can certainly do away with the email permission bit, if we were to implement yet-another-web-app that could act as an api, where you could receive said user's information and send an email from the script owner's email address, as opposed to that of the user executing the script.
we could also create a spreadsheet first and use that sheet's id as a static value (which is what most folks do in many of their scripts - including me) and not have a "wholistic" automation process - that way, we can also let go of the drive and spreadsheet access permissions.
challenges
the one place where i was most indubitably stumped was having to pass spreadsheet data in addRows() as an array but thanks to a user who goes by cooper on stackoverflow, i was able to combine their solution along with the one presented by another user to make this happen!
function getEvents() {
  var range = activeSheet.getRange(2,1,activeSheet.getLastRow()-1,2);
  var values = range.getValues();
  for(var i=0;i<values.length;i++) {
    values[i][0] = Utilities.formatString('%s/%s/%s',new Date(values[i][0]).getMonth()+1,new Date(values[i][0]).getDate(),new Date(values[i][0]).getFullYear());
  }
  return values;
}the client-side code as invoked from within the html file
function drawChart(rowData) {
  var dataTable = new google.visualization.DataTable();
  dataTable.addColumn({
    type: 'date',
    id: 'Date'
  });
  dataTable.addColumn({
    type: 'number',
    id: 'Meetings'
  });

//this is where the challending part of the code starts

  var values = rowData;
  if (values !== undefined) {
    var eventData = [];
    for (var i = 0; i < values.length; i++) {
      var rowData = [];
      for (var j = 0; j < 2; j++) {
        if (j == 0) {
          rowData.push(new Date(values[i][j]));
        } else {
          rowData.push(values[i][j]);
        }
      }
      eventData.push(rowData);
    }

//this is where the challending part of the code ends


    dataTable.addRows(eventData);

    var chart = new google.visualization.Calendar(document.getElementById('calendar_basic'));
    var options = {
      title: "Meetings Heatmap",
      height: 1500,
    };

    chart.draw(dataTable, options);
  }
}
codebase
you can access the entire script on my github repository here.
implementation
the long way (recommended)
you can 'make a copy' of the script that's hosted on my account, here & follow through the steps listed below -
- go to meetings heatmap script, then click on file > make a copy.
- take a moment to review the code and ensure that you don't execute any of the functions that you aren't comfortable with.
- choose the publish > deply as web app... options from the main menu, that would open up a dialog box.
- select the -
- project version = new
- execute the app as = me
- who has access to the app = only myself
obviously you're free to make any necessary changes on step 3, based on the kind of access you intend to provide others, to your meetings's heatmap.
the easy way
you can make use of the web app that i've hosted on my gsuite account and have the heatmap made available in just 3 clicks.
caveat: do please note that this may not be the best/safest option as it would require you to allow all the aforementioned levels of access to your calendar, google drive, gmail etc. and so kindly proceed with caution and at your own risk.
demo
here's a version that has some dummy data populated -
revoke access
in case you wish to revoke all access of your account from this script -
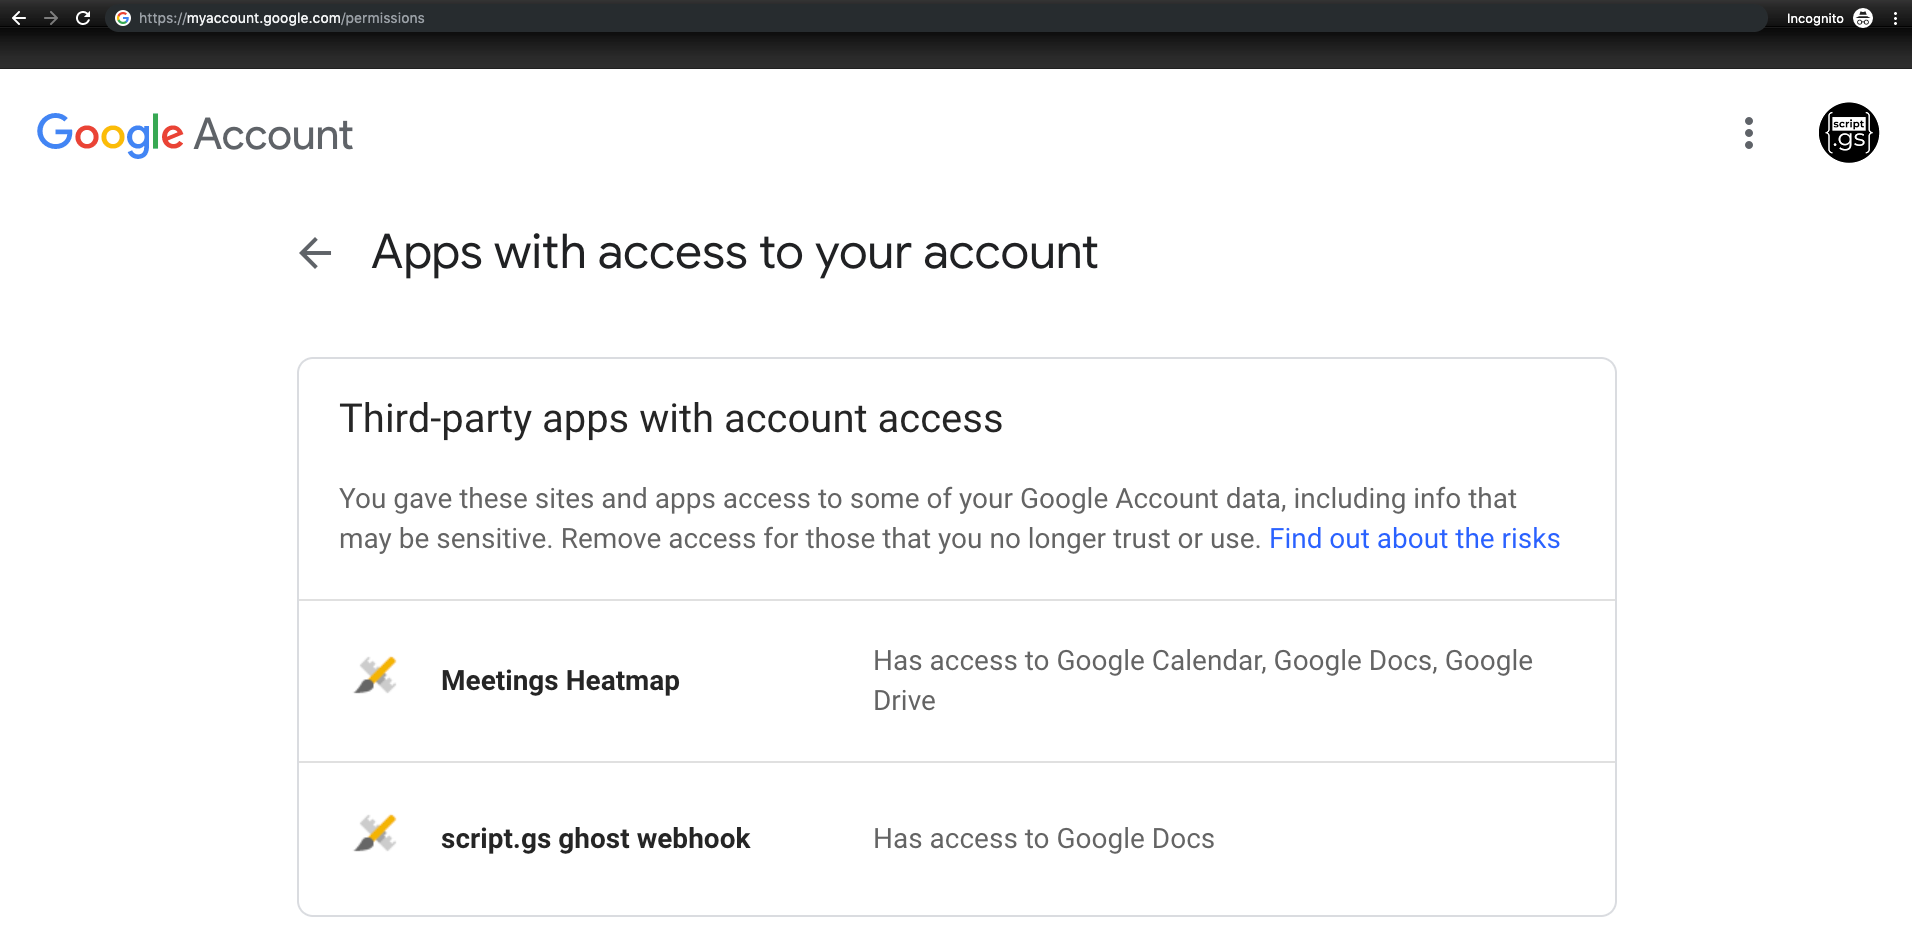
2. locate and click on meetings heatmap that would have a big, blue 'remove access' button