Connecting 'Tweet counts' API to Data Studio using a Community Connector
A community connector with overridable config parameters to track recent Twitter trends for a query.

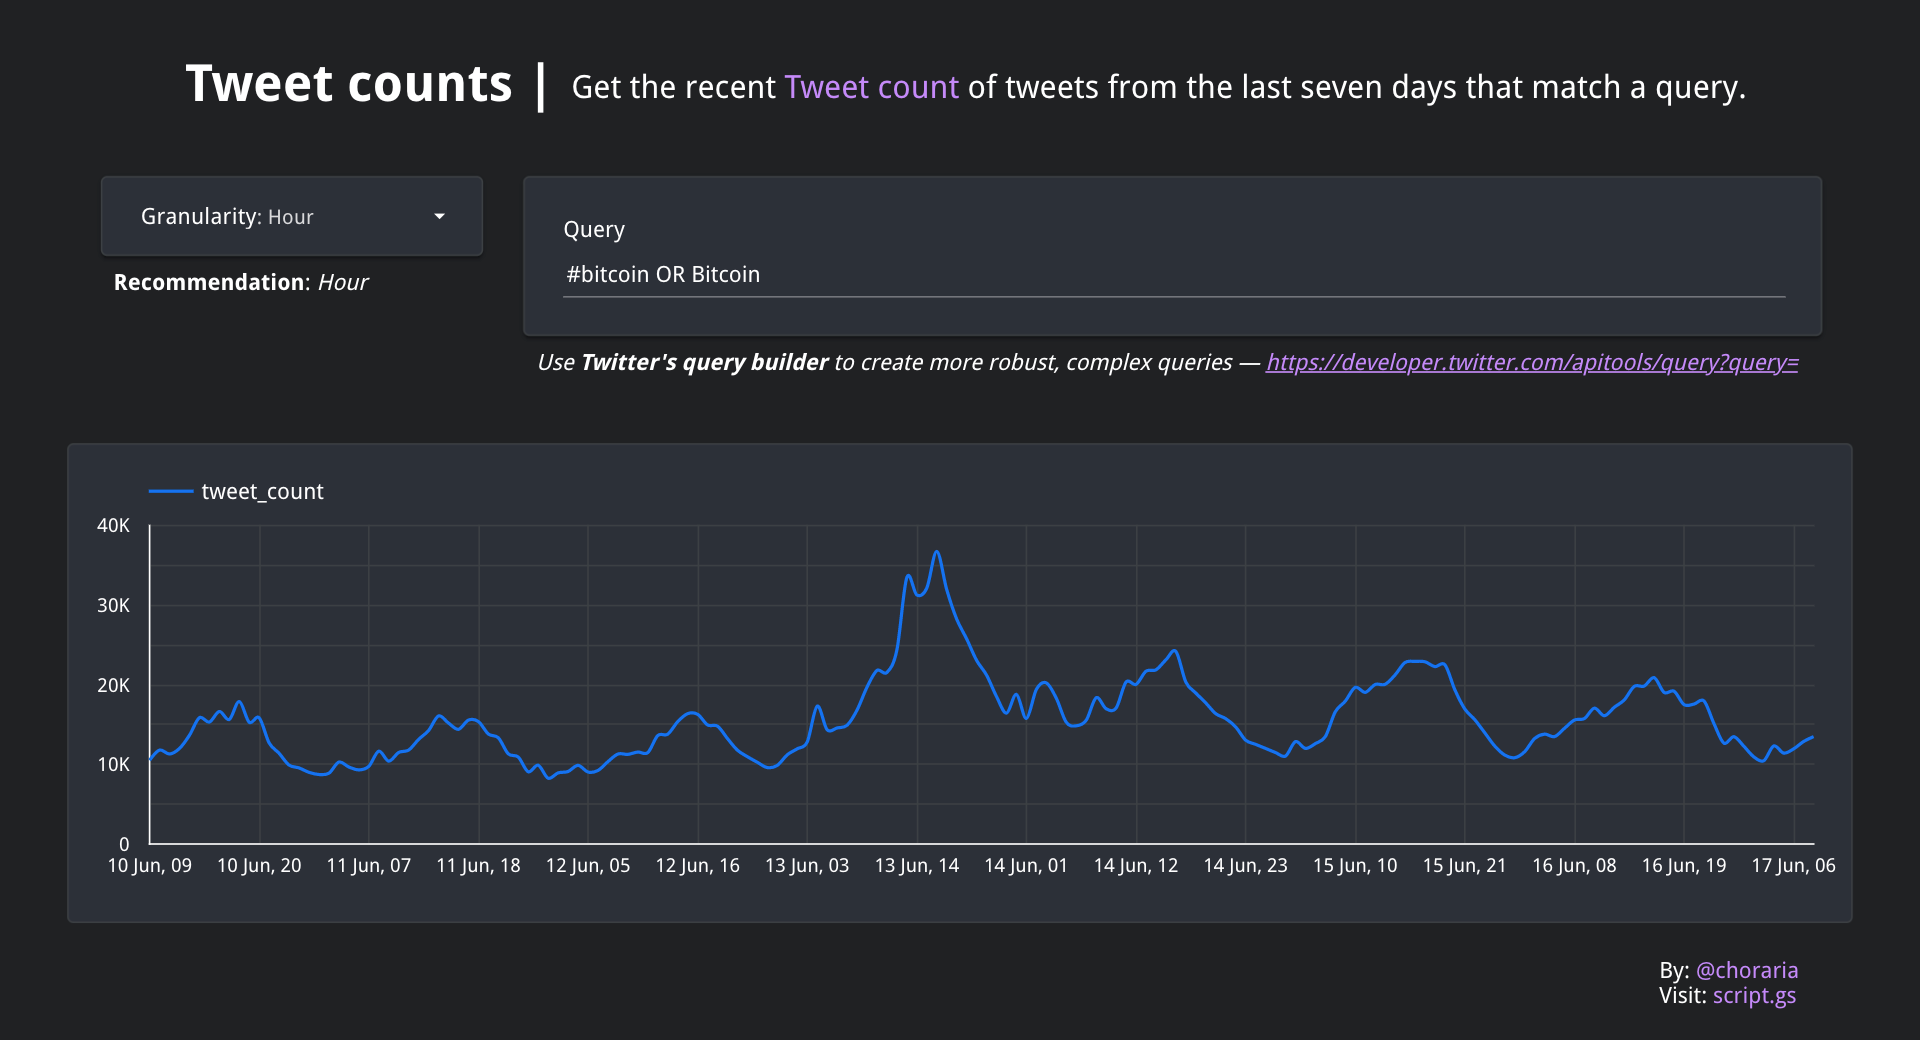
The moment I lay my eyes on this API, it instantly occurred to me that we could very easily try and create something similar to Google Trends, just for a much smaller frequency though (7 days).
Demo
You can create a data source using this connector directly by navigating to the following link —
https://datastudio.google.com/datasources/create?connectorId=AKfycbzHF4sg2NSUsJuVMkROxHcLn1g2sPquWKGjBuLXiHa1gXmcXtNwBbxkeSTEsRQAFKJM
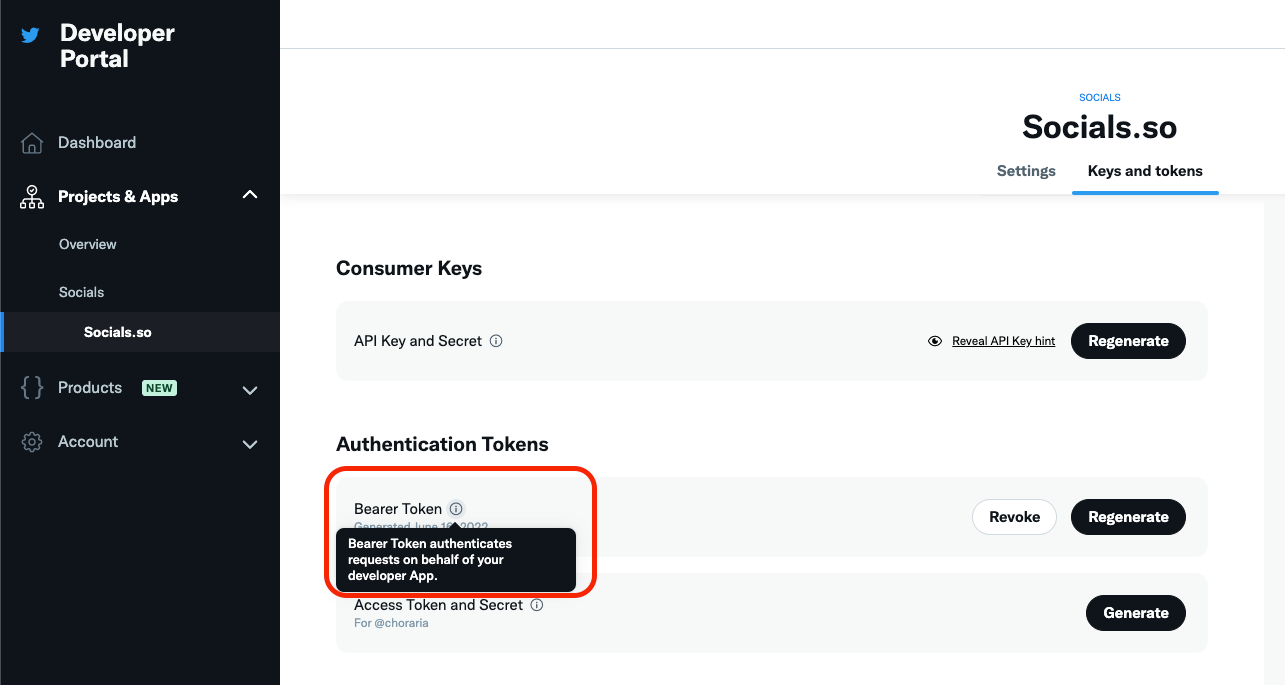
Note: You'll need to have/create a Twitter Developer Account to get a Bearer token, which will be needed as the "key" to power this connector/endpoint.
Architecture
For the most part this connector is pretty similar to the one I'd created for visualising global stats of SendGrid user’s email statistics but with a key difference of making use of overridable config parameters — this is what gives the connector the capability to accept a query from the report directly and return/visualize the data based on a user's input 🔥
Codebase
You can access the entire script on my GitHub repository here or make a copy of this script here.
Gotchas
Here are some of the caveats you may want to take into account too —
- You'll require a Bearer token from Twitter as this endpoint only supports the "app-only" authentication — meaning: if you were to use an auth token granted by OAuth 2.0 via another user, the API would simply fail citing that no user-context credentials can be used to fetch the data 😤
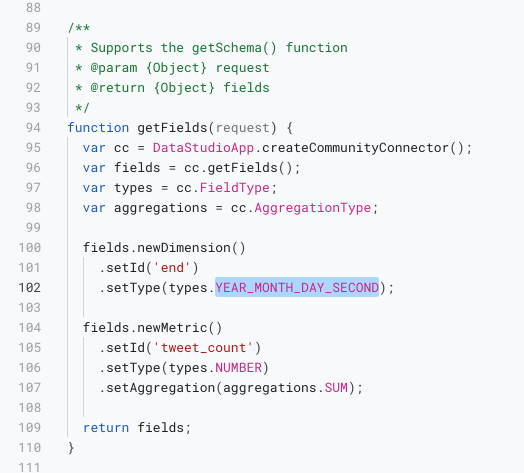
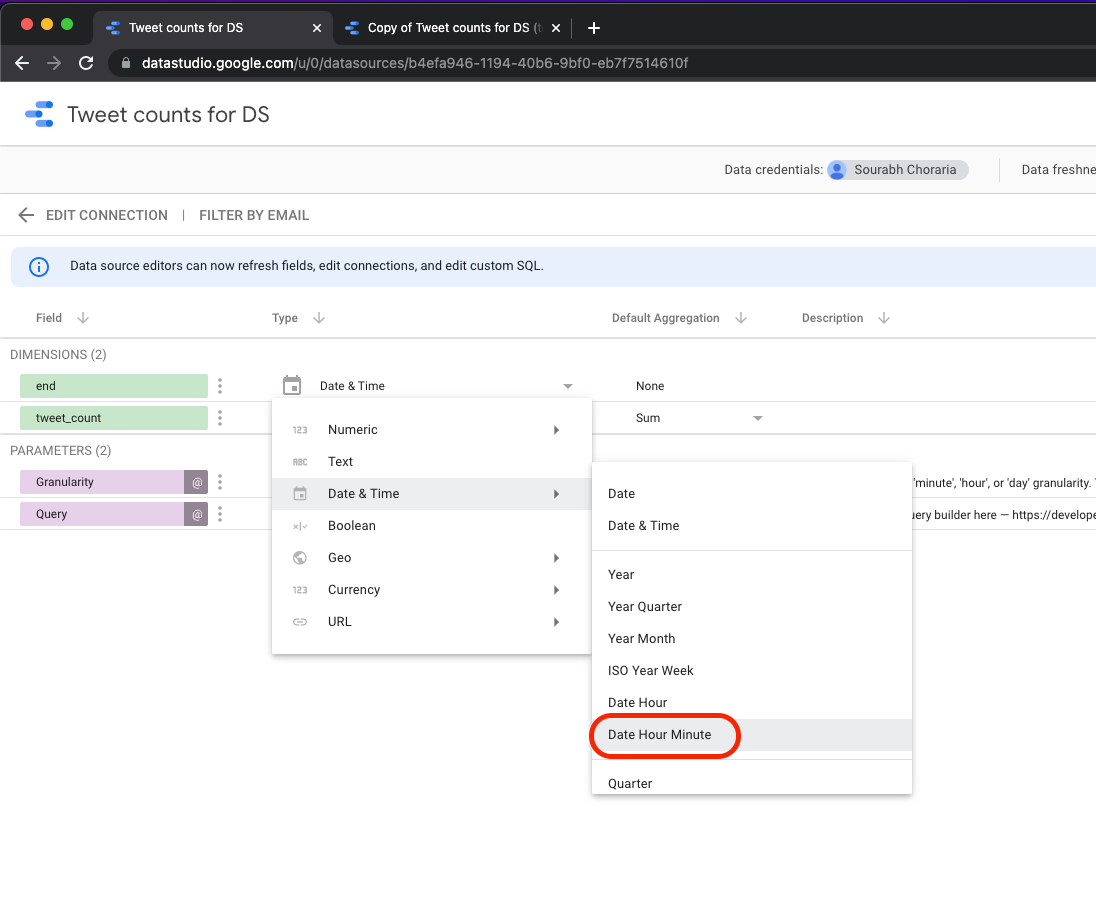
- While I am using the
YEAR_MONTH_DAY_SECONDSemanticType when generating the timestamp dimension that's being returned by Twitter, the connector still only detects it to be aDate & Timedata type as opposed to theDate Hour Minuteone —
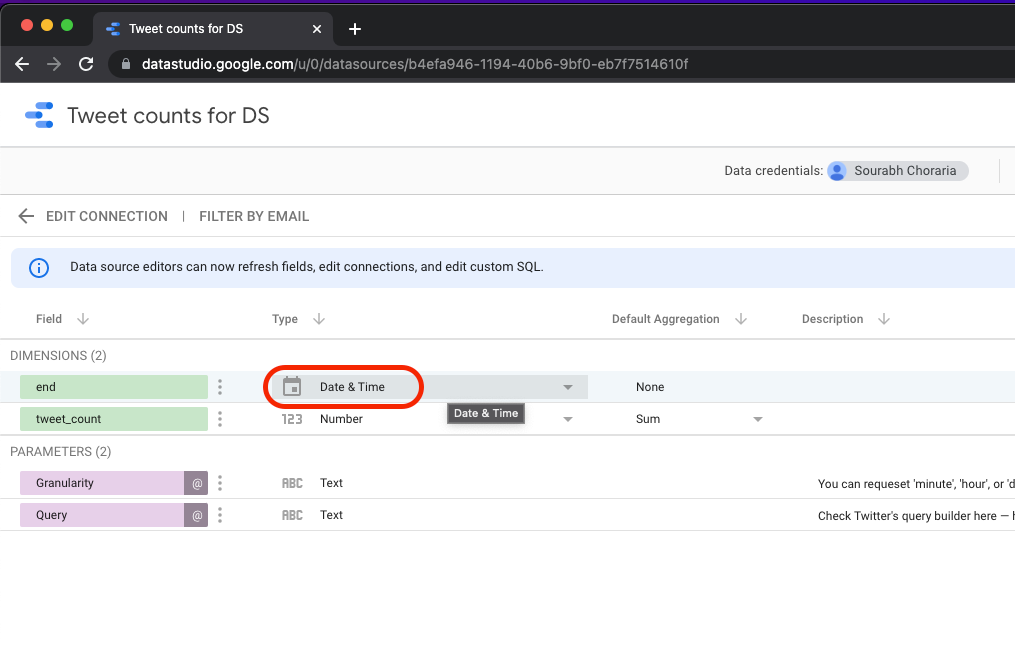
- It's a bit of a pain because the time series chart in Data Studio otherwise fails to render, citing that there were too many rows — factually impossible because the Tweet counts API only returns the last 7 days worth of data with the smallest granularity being that of minutes => 7*24*60 => 10080 + 1 (header) rows
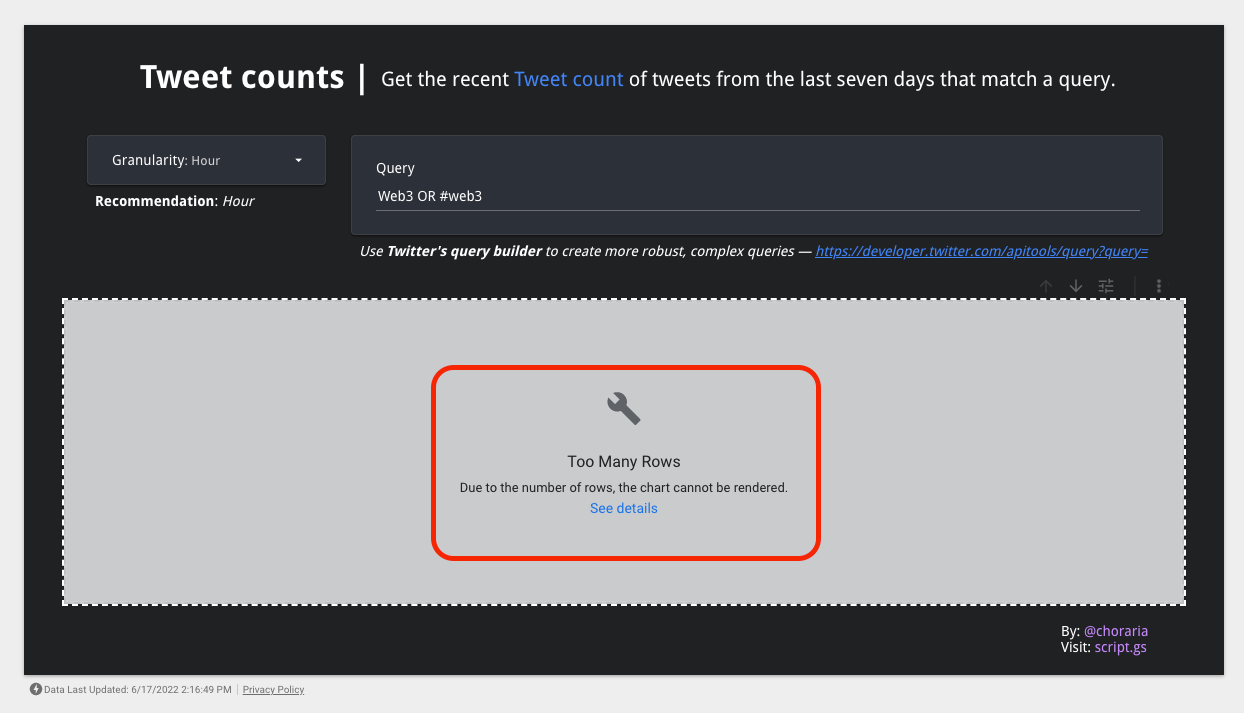
- Which is a long way to say that though the template is set to assume the
Date Hour Minutedata type, every time someone new tries to configure the connector on their own, they'll still end-up with theDate & Timedata type as the default and will need to manually set it toDate Hour Minute(please don't hate me for that 😅)
Pro tip
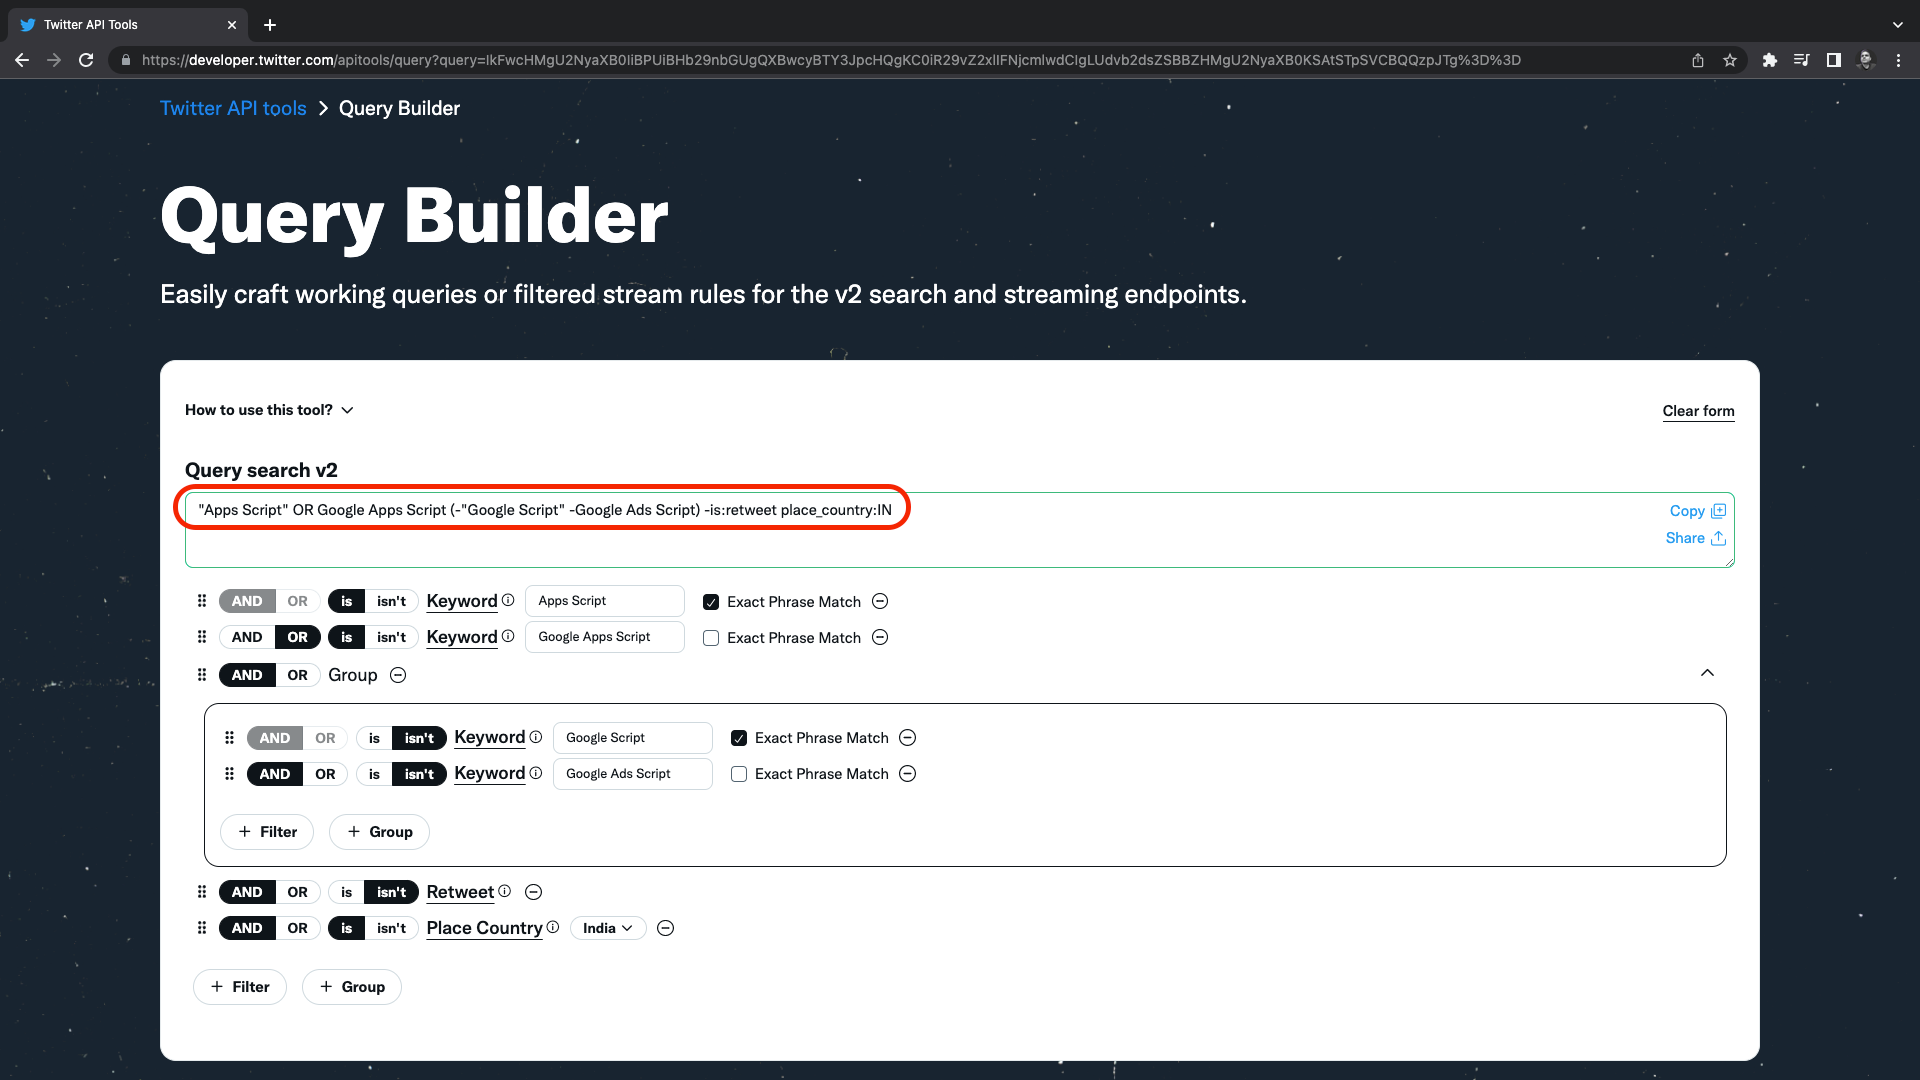
- I'd highly recommend making use of Twitter's query builder tool as it can help accurately filter and group specific components of whatever it is that you're looking for. Here's an example snapshot —
- Since you've been so kind as to read all the way through, in case you don't want to set up a Twitter Developer Account of your own or are having issues setting up the Data Studio connector altogether and still want to experience the magic of the kind of data you can gather from this report, just DM on Twitter with a request to play with the dashboard that I've created (using my credentials) and I'd be happy to share. Can't do so publicly as it would most certainly run out of quotas 😅