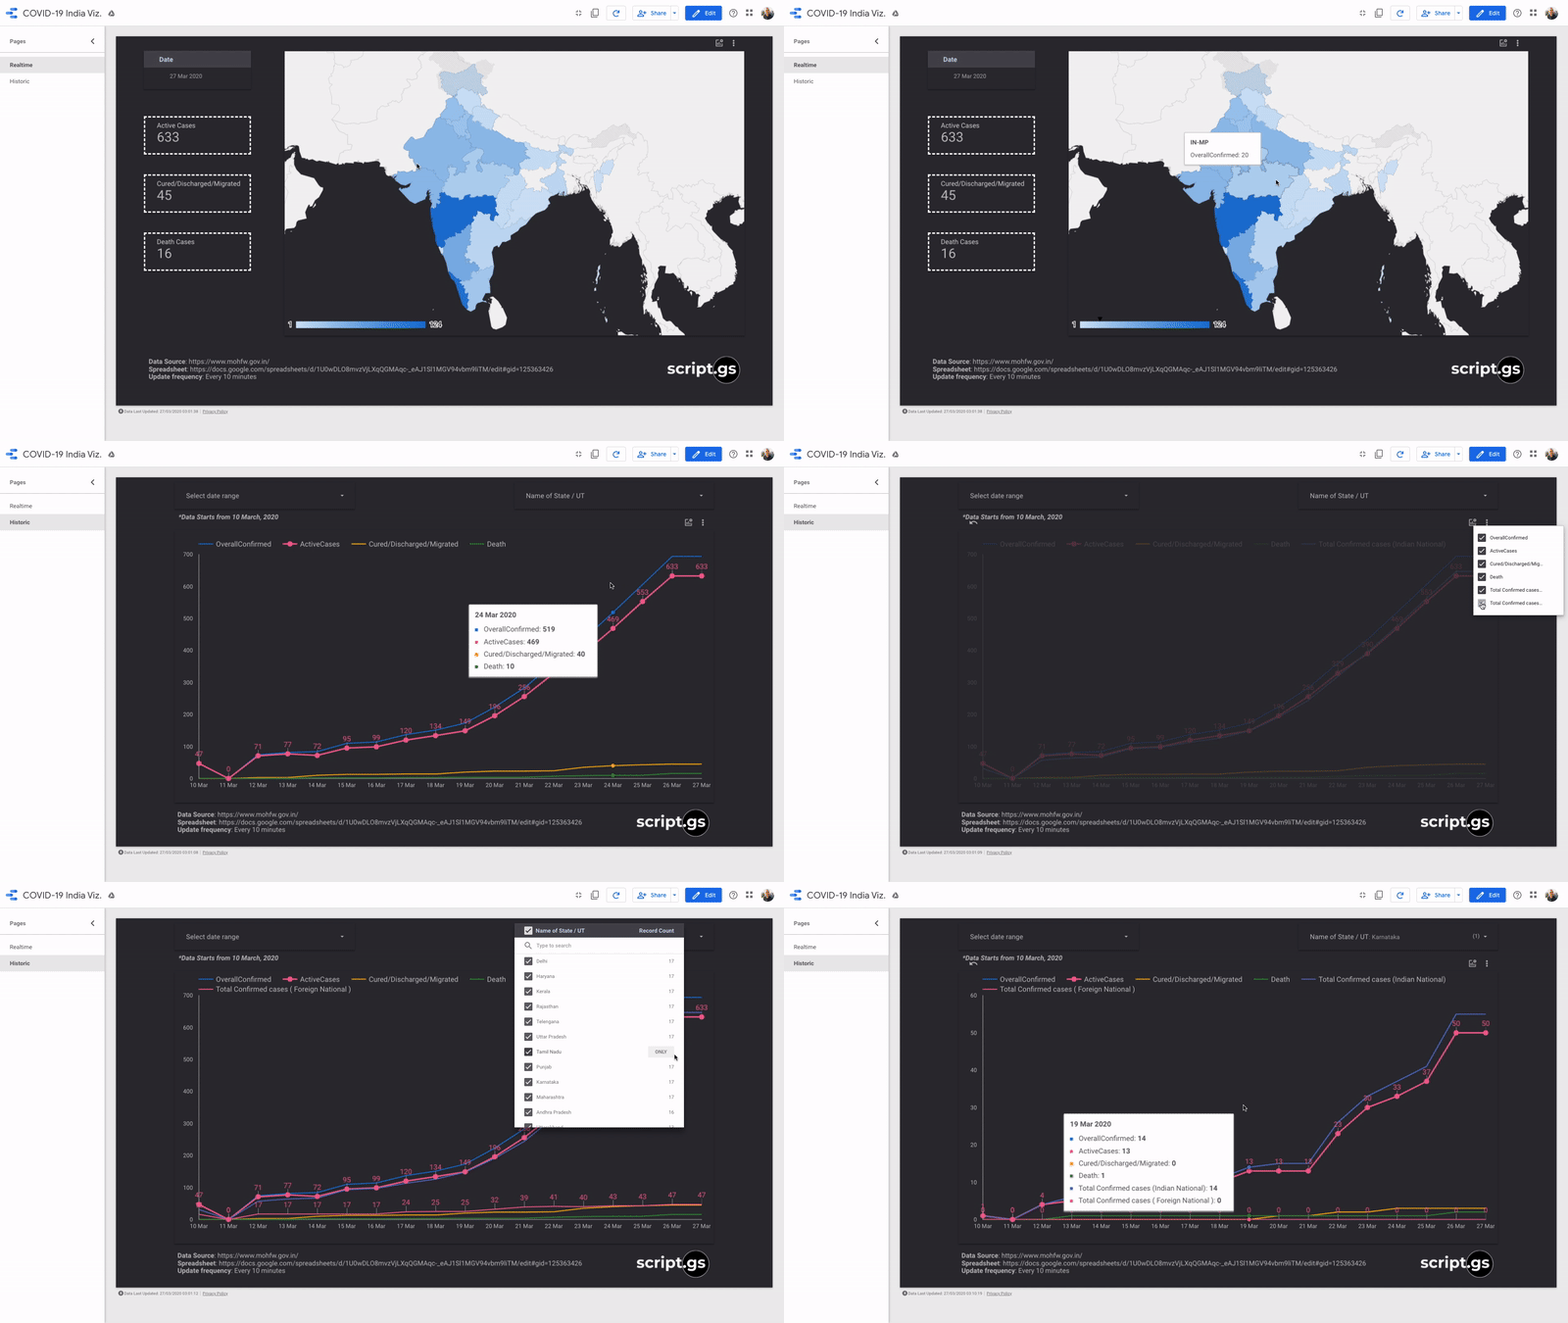
Building a Data Studio dashboard to track Indian COVID-19 cases in realtime
Revisiting the power of Google Sheet's native IMPORTHTML function along with some Apps Script magic to visualize COVID-19 cases in India using Data Studio.

inspired by amit agarwal's (@labnol) work on building a covid19 tracker in google sheets, i thought it might do some good if we could also get some visualization around it - while part of the data that's being gathered for this setup is built using google apps script, a good chunk of it is also contributed by the =IMPORTHTML function that exists natively on sheets.
while working on apps script for a project at work, the task got me thinking that i've not been appreciating the formulas that already exist in spreadsheets for our benefit, enough. i suppose, while working towards building the data studio dashboard, this thought was very much in the fore front of my head.
dashboard
in case you're here to just get your hands on the data studio viz, you can access it here and of course, the raw data on the sheets can be found here.
setup
lucky for us, the indian ministry of health (moh) is diligently updating information on their homepage where the data is being updated on a table created using html - lucky for us, google spreadsheets already provides us with a way to scrape information specifically from there html elements - IMPORTHTML.
this is precisely what i ended up doing on my sheet, where the first tab consists of a mildly complex formula to handle a couple things, like -
- remove
*s and#s from the data usingREGEXREPLACE - convert numbers from string (text) to an actual number format using
VALUE - and finally, be able to handle all other erroneous exceptions using
IFERROR
this is what the formula looks like in its current state -
=ArrayFormula(IF(ISTEXT(IMPORTHTML("https://www.mohfw.gov.in/","table",8)),IFERROR(VALUE(REGEXREPLACE(IMPORTHTML("https://www.mohfw.gov.in/","table",8),"\*|#","")),REGEXREPLACE(IMPORTHTML("https://www.mohfw.gov.in/","table",8),"\*|#","")),IMPORTHTML("https://www.mohfw.gov.in/","table",8)))
next was to write a simple apps script that took the data from the source sheet that we just configured using spreadsheet formulas and then log it chronologically on another tab.
var timeZone = Session.getScriptTimeZone();
var now = Utilities.formatDate(new Date(), timeZone, "YYYY-MM-dd");
var scriptProperties = PropertiesService.getScriptProperties();
var logDate = scriptProperties.getProperty("date");
var ss = SpreadsheetApp.getActiveSpreadsheet();
var sourceSheet = ss.getSheetByName('=IMPORTHTML');
var sourceSheetValues = sourceSheet.getDataRange().getValues();
var sourceSheetHeaders = sourceSheetValues[0];
var sourceSheetStateIndex = sourceSheetHeaders.indexOf('Name of State / UT');
var logSheet = ss.getSheetByName('DataLogger');
var logSheetValues = logSheet.getDataRange().getValues();
var logSheetHeaders = logSheetValues[0];
var logSheetDateIndex = logSheetHeaders.indexOf('Date');

function logData() {
  if (logDate == now) {
    deleteRows(now);
  }
  var newValues = [];
  for (var i = 1; i < sourceSheetValues.length; i++) {
    var row = sourceSheetValues[i];
    if (row[sourceSheetStateIndex] !== "") {
      row.push(now);
      newValues.push(row);
    }
  }
  logSheet.getRange(logSheet.getLastRow()+1, 1, newValues.length, newValues[0].length).setValues(newValues);
  scriptProperties.setProperty("date", now);
}

function deleteRows(now) {
  for(var i = logSheetValues.length - 1; i > 0; i--) {
    var logSheetDateValue = Utilities.formatDate(logSheetValues[i][logSheetDateIndex], timeZone, "YYYY-MM-dd");
    if (logSheetDateValue == now) {
      logSheet.deleteRow(i+1);
    }
  }
}note that what i do here is instead of logging every attempt, i delete the older data and then capture the new set of information; that way, i don't end up storing more rows that what i actually require.
in order to be able to create a really good-looking and obviously, an accurate geo-heat-map in google data studio, i also had to ensure that i had the perfect mapping of all the locations in it's various formats - this was updated manually on another sheet that I then got to use as blended data sets in data studio.
the final task was to simply connect the wrangled data to data studio using their sheets connector 😊
